Introduction
![]() The Dashboard will be the first page displayed whenever a user logs onto Guardian Live.
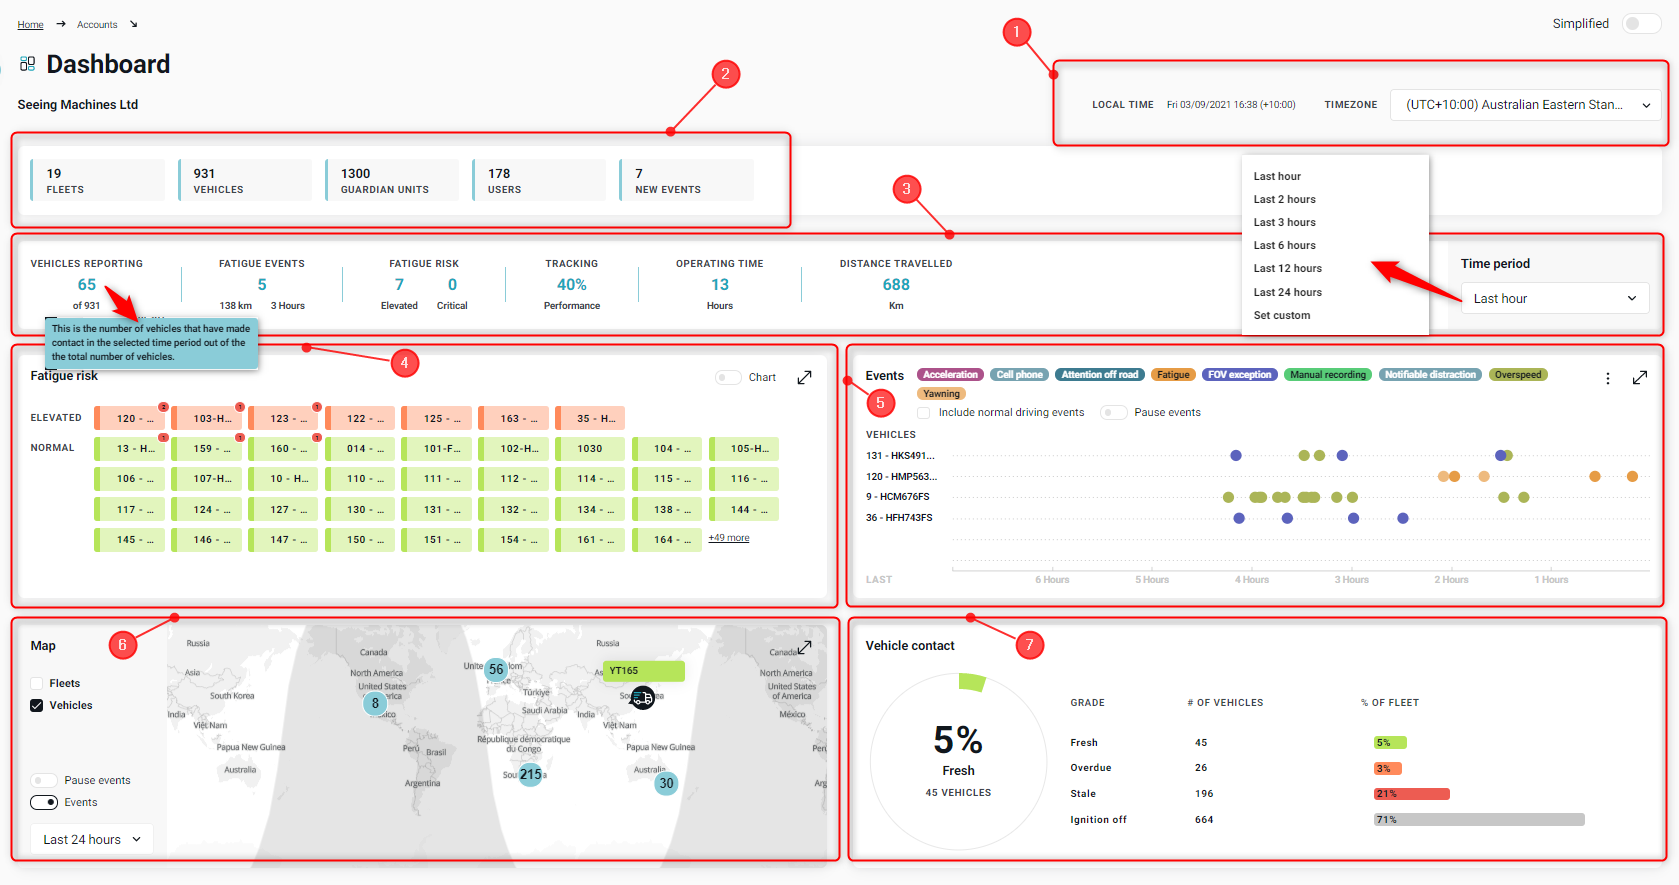
The Dashboard will be the first page displayed whenever a user logs onto Guardian Live.
The dashboard provides a snapshot of the user’s Scope and Grant.
Event and Risk Count
Event and risk count. Hovering over the value will provide additional information to help users understand the data they are seeing. Users can filter this information based on a Time period of their choosing.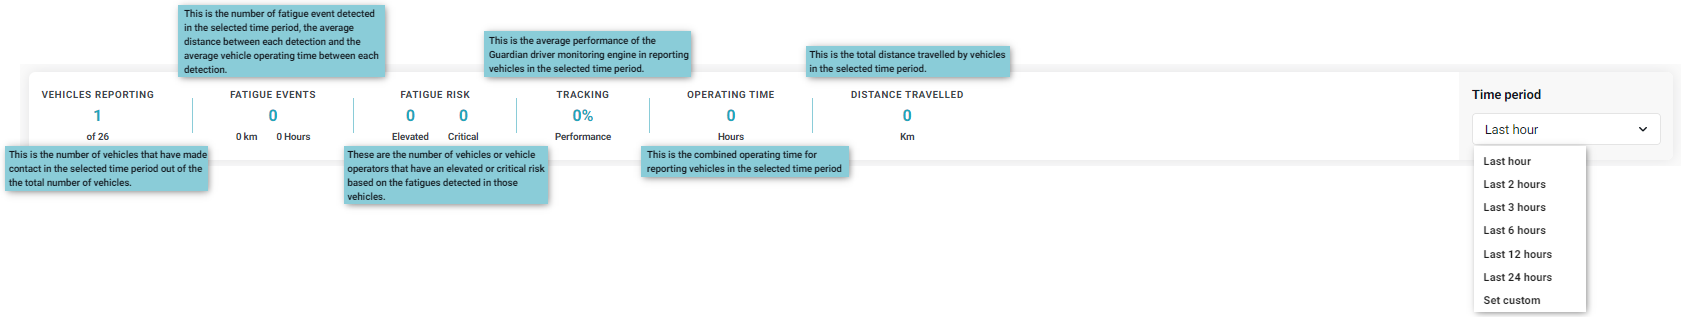
Fatigue Risk
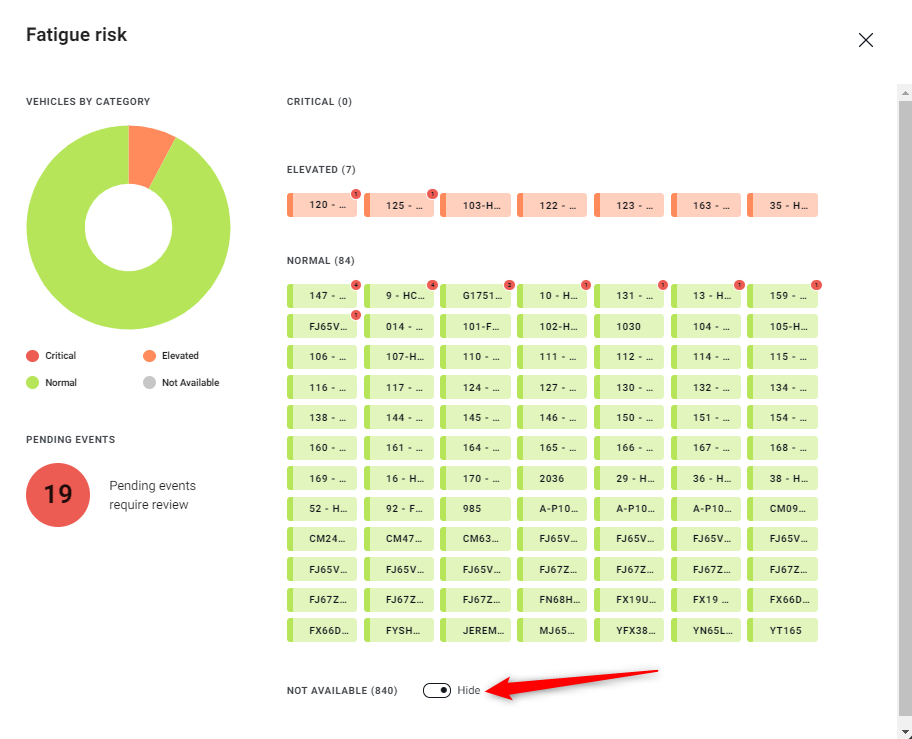
This chart shows all the vehicles in the Account with their Fatigue risk. A vehicle in red has an elevated Fatigue risk based on the number of Fatigue events detected for that vehicle. The tile will only display 6 rows. Users can click on the ‘expand’ arrow ![]() (top right of the tile) to enlarge their view. Read this article for more information about Fatigue risk.
(top right of the tile) to enlarge their view. Read this article for more information about Fatigue risk.
-
- Vehicle names with a red badge show the number of events that are pending ‘classification’ by the Guardian Centre.
- Users can click on individual vehicles to view the most recent Events for that vehicle.
- Users can click on the ‘+[number] more to view all vehicles within the Scope. A risk graph will also be presented in this view. Users can select to ‘Hide’ or ‘View’ vehicles that are ‘not available’.
- Vehicle names with a red badge show the number of events that are pending ‘classification’ by the Guardian Centre.
-
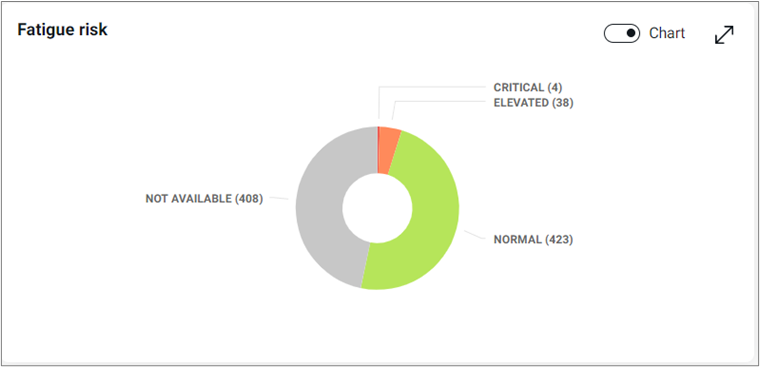
- User can ‘toggle’
 their view from the tiles to the risk donut.
- User can ‘toggle’
Events
This graph shows the events in the time period. Users can select the combination of events they wish to review. When toggling between event types, the view will ‘Pause’. To refresh the view, ensure that ‘Pause events’ is turned off.
Hovering over the event will provide additional detail. Clicking on the event will provide even more information. Read this article for more information about Events.
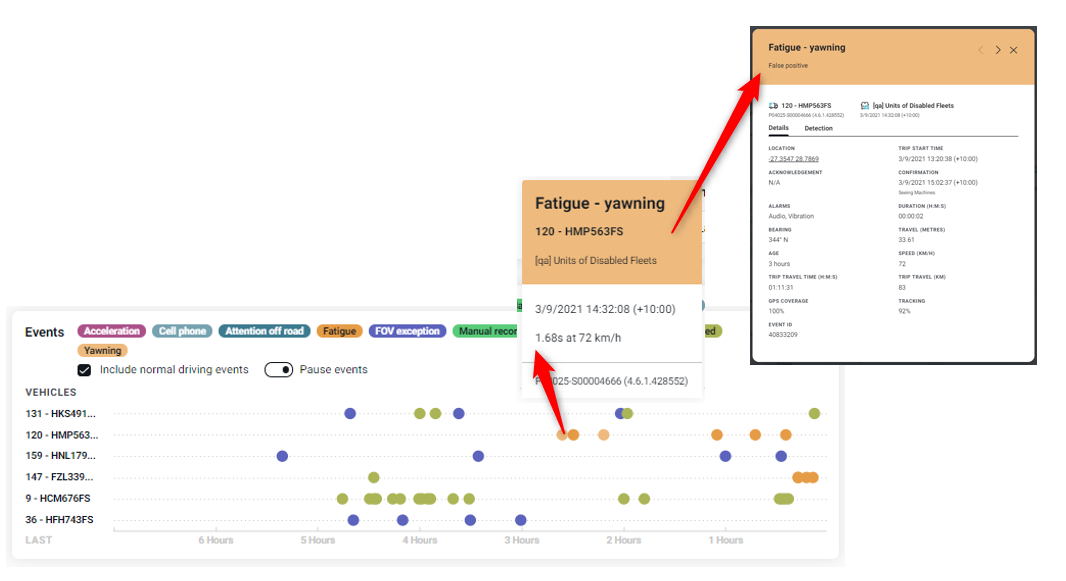
Users can also click on the arrows top right ![]() to navigate to other events for that vehicle.
to navigate to other events for that vehicle.
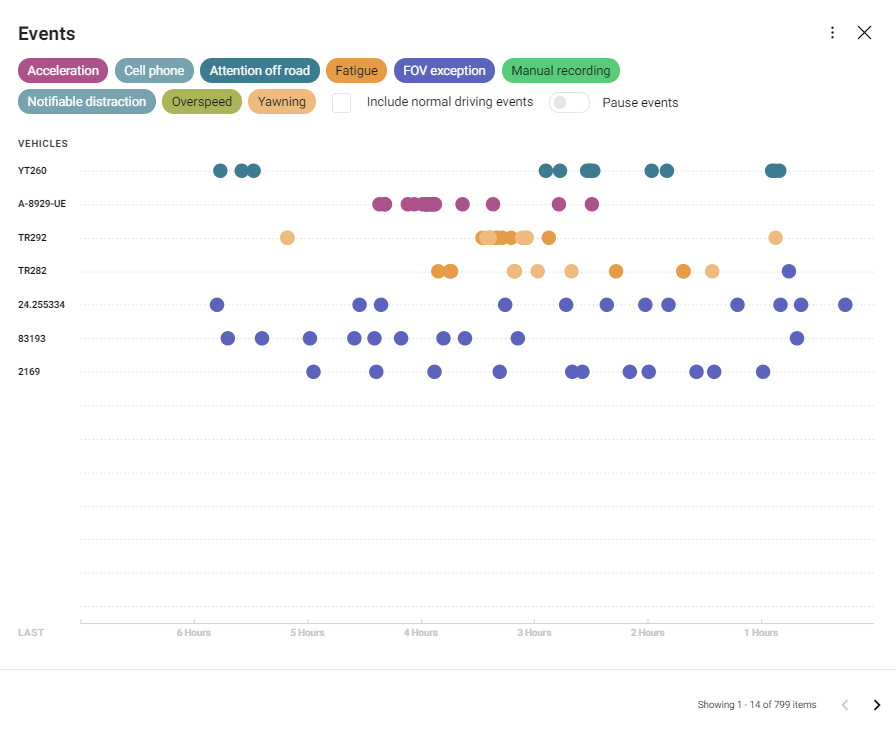
Users can also expand this view ![]() which will sort by the vehicles with the most events, or vehicle name (in alphabetical order).
which will sort by the vehicles with the most events, or vehicle name (in alphabetical order).
Map
The map will identify where units are located using the last known location. Clicking on the vehicle number will zoom into the location. Clicking on the vehicle will provide additional details about the vehicle. Users can also expand on the map to see more detail including events.
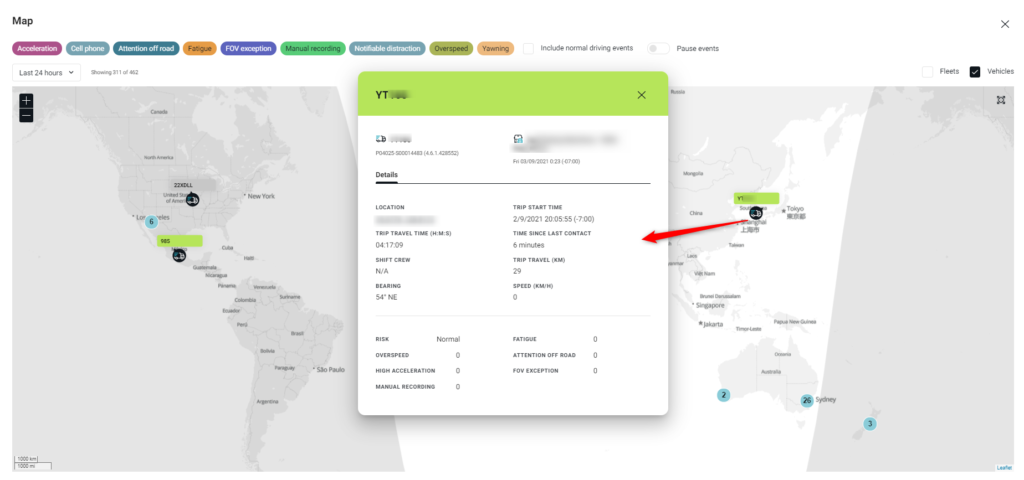
The map navigation is the same as most online map tools. Users can zoom in and move around the map.
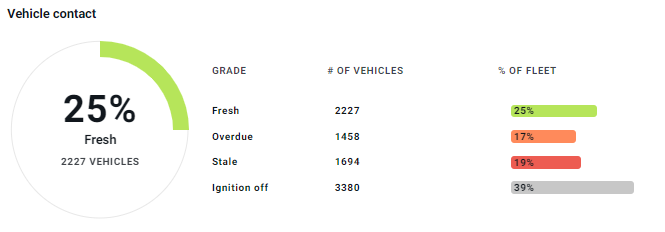
Vehicle Contact
Provides a graph of vehicle contact. Users can click on the ‘Grade’ and ‘Vehicles’ to view more detail. Read this article for more information on Vehicle Contact.